
*Highland Heights Police would like to share with everyone that Highland Heights has been named one of the safest cities in Kentucky for 2020*
No. 15 Highland Heights
Just over 7,000 people reside in Highland Heights, a town in Northern Kentucky between the Licking and Ohio Rivers. However, around 15,000 people visit Highland Heights throughout the year to attend Northern Kentucky University, most of whom commute to the school from nearby towns. Despite the ballooning population during the school year, Highland Heights remains one of the safest cities in Kentucky.
State Overview
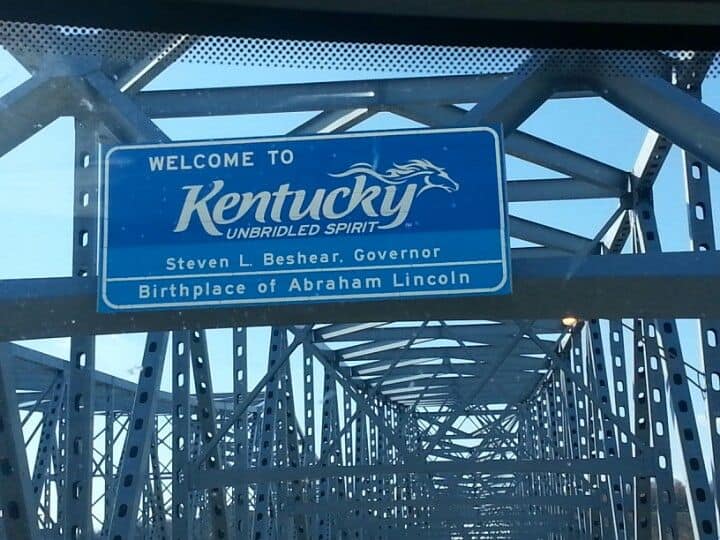
The state of Kentucky is bordered by the Ohio River to the north and the Appalachian mountains to the east. It may be best known for its cuisine, bourbon and horse racing, but there is a lot more to it than that. The state is a great place for nature lovers, with plenty of state parks, natural springs caves and mountains. Kentucky also has significant national history as the birthplace of Abraham Lincoln. Visitors to the state can explore the Abraham Lincoln Birthplace National Historic Park to learn more. With a population of almost 4.5 million people, the state is also home to a variety of urban centers and small-town communities. Let’s take a look at which of these cities in Kentucky are the safest.
How We Determined the Safest Cities in Kentucky
We narrowed down the safest cities in each state based on two primary categories. First, we evaluated public safety factors including violent, property and hate crimes in each area to help determine the safest areas to live. We then evaluated financial and socioeconomic factors including household income, average rent and health insurance. In addition, we evaluated each state for natural disaster safety and public health safety. You can find a detailed breakdown of our methodology and links to sources here.
Here are the public safety factors we counted for each city:
*Public safety data is based on a population of 10,000 (for example, a “2” means two incidents for every 10,000 people).
- Property crime – Number of property crimes reported in the city (FBI Crime Report)
- Violent crime – Number of violent crimes reported in the city (FBI Crime Report)
- Aggravated assaults – Number of aggravated assaults reported in the city (FBI Crime Report)
- Hate crime – Number of hate crimes reported in the city (FBI Hate Crime Report)
- Officer-related incidents – Number of officer-involved shootings reported in the city (Gun Violence Archive)
- Mass shootings – Incidents in which four or more people are shot/killed in the city (Gun Violence Archive)
Here are the financial safety factors we counted for each city:
- Annual rent – Annualized median rent
- Unemployment rate – The average rate of unemployed residents in each city
- Cost of living – The average annual rent and household income per city
- Poverty rate – Percentage of families that reported experiencing poverty in the last 12 months
- Uninsured employed – Percentage of employed residents that reported not having health insurance
- Uninsured unemployed – Percentage of unemployed residents that reported not having health insurance
The full report can be found here:
https://www.safety.com/public/places/safest-cities-in-kentucky/